
Commercial property insurance has been getting cheaper for two years.1 For owners who spent the previous stretch absorbing double-digit increases at every renewal, that relief is welcome and overdue. It has also encouraged a conclusion that does not follow: that physical risk has receded as a factor in real estate economics.
Prices and assessments are separate things. What an owner pays to transfer risk this year reflects conditions in reinsurance capital markets. What an underwriter believes can happen at a particular address reflects the address. The first has fallen sharply. The second does not reset simply because insurance capacity has become more abundant.
The distinction matters most where insurance meets debt, because lenders underwrite across a hold period rather than a renewal cycle. Understanding how a policy becomes a loan term is a useful way to see why location remains an economic variable even when coverage is cheap. For advisors evaluating listed real estate, it also helps explain why an insurance premium alone may not fully capture property-level physical climate risk.
What a Softer Market Did and Did Not Change
The scale of the shift is worth establishing. Marsh reported that global commercial insurance rates fell in the second quarter of 2026 for the eighth consecutive quarter, with property declining further than any other line, down 12% globally1 and 13% in the United States. Marsh attributed the move to insurer profitability, surplus capital, lower reinsurance costs, and stronger investment returns.1
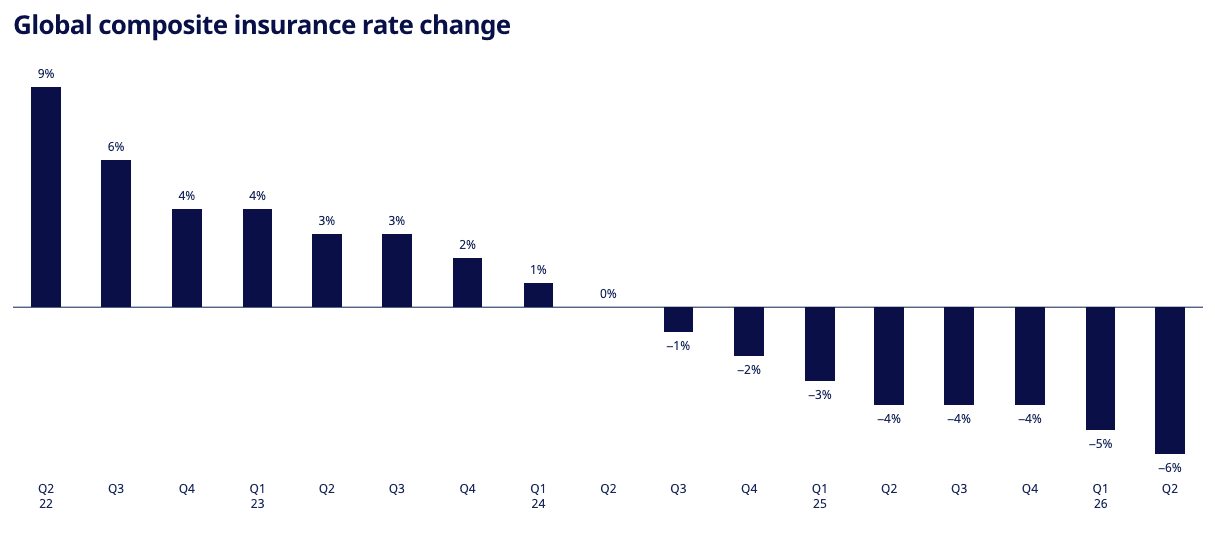
Source: Marsh "Global Insurance Market Index, Q2 2026"
None of those drivers describes a building. They describe the supply of capital willing to bear risk.
Marsh observed at the same time that outcomes continued to vary by geography and catastrophe exposure, and that underwriting results were increasingly driven by exposure quality.1 Lower prices reached most of the market while underwriters went on distinguishing between the properties inside it. One figure illustrates how easily this can be misread: catastrophe-exposed programs above one million dollars in premium saw rates fall 20% in the quarter, against 10% for non-catastrophe programs below that threshold.2 The larger decline came off a higher base, in the segment that had absorbed the steepest increases on the way up.
A Premium Carries Two Kinds of Information
The first is the current cost of transferring risk, which moves with available capital, carrier profitability, and competitive pressure. It is cyclical, and at present it is falling.
The second is the underwriter’s estimate of what can happen at a specific location. That estimate reflects elevation, distance to water, wind and hail exposure, wildfire interface, drainage, construction type, and the age of the roof. Reinsurance capital rebuilding does not itself change those location- and property-specific inputs.
Through the hard market both figures rose together, which made them easy to treat as a single signal. They have since come apart, and the separation is informative. An investor reading insurance expense in REIT filings as a proxy for location risk would have drawn a reasonable inference three years ago and would draw a misleading one now. Insurance expense remains a relevant operating variable, but it is not a complete proxy for the physical exposure associated with the properties supporting that income.
Insurance in the Loans
Property insurance is an operating expense. It sits above net operating income or NOI—the income remaining after property operating expenses and before debt service. Lenders use NOI to assess debt-service coverage, often expressed as the Debt Service Coverage Ratio (DSCR)*.
The arithmetic is unremarkable, which is precisely why the effect is easy to overlook.
The consequence appears early in a transaction. A borrower brings a deal that clears the lender’s coverage floor on the borrower’s own operating figures. The lender substitutes its own expense assumptions, and where its view of replacement cost exceeds the insured value carried on the policy, it underwrites the premium required to insure to its own figure. That adjustment flows through net operating income into the coverage ratio before a term sheet exists.
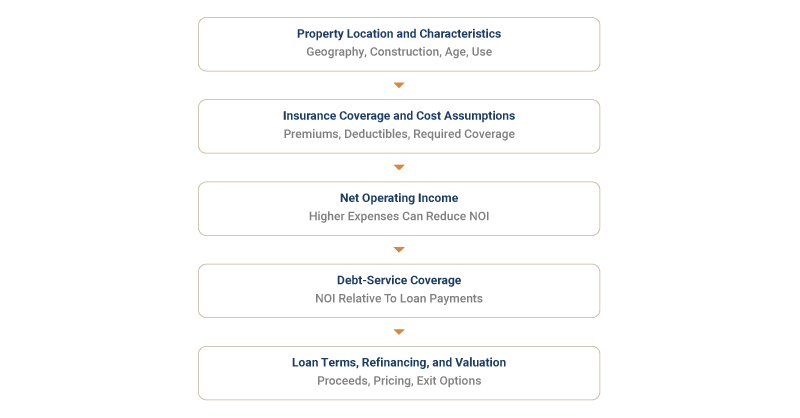
Lenders also underwrite forward. A loan written today may run five, seven, or ten years, and few underwriters assume that a soft market persists across that horizon. The insurance assumption embedded in a loan sized in 2026 is often based on forward-looking insurance-cost assumptions rather than the premium quoted at closing.
Availability Is a Separate Constraint from Price
Premium is only part of what a loan document governs. Lenders set minimum coverage requirements and maximum acceptable deductibles as conditions of financing, and blanket programs covering multiple properties draw additional scrutiny. A blanket program is a policy that provides coverage across more than one property and may require lenders to evaluate how limits, deductibles, and loss coverage apply to an individual asset.
Where the market declines to write on the terms a loan requires, cheaper premiums leave the problem in place. The constraint is availability rather than price, and the two do not soften together. A property may be inexpensive to insure and still difficult to insure adequately, which can become a material issue during a refinancing.
This matters more than usual at present. The Mortgage Bankers Association reported that 875 billion dollars of the 5.0 trillion dollars in outstanding commercial mortgages was scheduled to mature during 2026, roughly 17% of balances.3 A large volume of property is meeting lender scrutiny in a compressed window, and coverage adequacy is part of what that scrutiny examines.
Why Regulators Watch This Channel
Financial regulators have described the same transmission in their own supervisory language. The Federal Housing Finance Agency’s advisory guidance on climate-risk management for Fannie Mae and Freddie Mac identifies credit risk as potentially increasing where insurance availability or affordability declines in higher-risk areas, alongside effects on collateral valuation.4
That guidance governs residential and multifamily housing finance rather than the listed commercial market, so it names the mechanism without measuring it for REITs. The mechanism itself is not specific to housing. Insurability conditions financing, and financing conditions value, in any asset class where lenders require coverage as a term of the loan. The FHFA guidance should therefore be read as an illustration of the economic channel, not as a direct rule governing listed commercial real estate.
What This Suggests for REIT Exposure
Traditional REIT indexes have generally emphasized market capitalization and sector classification. The Climate Global-Climate-Resilient REIT Index ETF (CLIM) incorporates a different category of information: insurance-industry climate and extreme-weather analytics applied at the property and portfolio levels. Its methodology is designed to incorporate property-specific modeled physical-risk information within a disciplined, transparent, rules-based approach to listed real estate exposure.
The value of this input is that it is intended to assess location-specific exposure rather than reflect only current insurance-market pricing. Unlike current market premiums, modeled expected-loss estimates are designed to evaluate property-level exposure; they may change as the underlying data, assumptions, and methodologies are updated. Advisors evaluating listed real estate may consider physical climate risk alongside sector mix, lease structure, balance-sheet quality, debt maturities, refinancing needs, and interest-rate sensitivity, not in place of those factors.
No methodology of this kind removes uncertainty. Models estimate expected loss rather than predicting events, they can be wrong in direction and magnitude, and their outputs change as data and methods are revised. REITs remain subject to equity market risk, interest-rate sensitivity, sector concentration, model risk, and the inherent unpredictability of future weather and economic conditions. Measurement differentiates physical risk. It does not remove it, and a portfolio built with these analytics is assembled differently rather than made safer.
Why This Matters to Investors
Insurance expense can be an important indicator of pressure on property economics, but it is not a complete measure of property-level physical risk. A lower premium may reflect a more competitive insurance market rather than a change in the underlying risk characteristics of the assets in a real estate portfolio.
For investors using listed real estate within broader client portfolios, property-level physical climate-risk analysis may be considered alongside traditional REIT evaluation factors, including geographic and sector diversification, leverage, income durability, debt maturity schedules, and interest-rate sensitivity. The question is not whether physical risk can be predicted away. It is whether a real estate allocation is using relevant information about the locations and properties that support its income and value.
What the current cycle offers is clarity. When the price of coverage falls for reasons that have nothing to do with any particular building, what remains is the question of the building itself, which is the question that was always the economic one.
For listed real estate investors, the distinction is worth keeping in view: an insurance premium reflects the current price of transferring risk; property-level analytics seek to evaluate the exposure that remains when that market price changes.
Explore the framework: Learn how insurance-industry climate and extreme-weather analytics can help assess physical climate risk at the property and portfolio levels.
Explore More Here: What Are Catastrophe Models?
Sources
Marsh "Global Insurance Market Index, Q2 2026"
Marsh "US Insurance Rates, Q2 2026"
Mortgage Bankers Association "17 Percent of Commercial and Multifamily Mortgage Balances to Mature in 2026"
Federal Housing Finance Agency "Climate and Natural Disaster Risk"
Definitions
*DSCR: debt-service coverage ratio, compares a business’s available operating income with principal, interest, lease, and other debt payments due—generally over the next year.
Carefully consider the Funds’ investment objectives, risk factors, charges and expenses before investing. This and additional information can be found in the Fund’s Prospectus and Summary Prospectus, which may be obtained by visiting www.climateglobaletf.com. Read the Prospectus and Summary Prospectus carefully before investing.
The Fund is distributed by Foreside Fund Services, LLC. Exchange Traded Concepts, LLC serves as the investment advisor. The Fund is distributed by Foreside Fund Services, LLC., which is not affiliated with Climate Global, Exchange Traded Concepts, LLC, or any of its affiliates.
Investing involves risk, including possible loss of principal. The Fund’s return may not match or achieve a high degree of correlation with the return of the Index. To the extent the Fund’s investments are concentrated in or have significant exposure to a particular issuer, industry or group of industries, or asset class, the Fund may be more vulnerable to adverse events affecting such issuer, industry or group of industries, or asset class than if the Fund’s investments were more broadly diversified. Issuer-specific events, including changes in the financial condition of an issuer, can have a negative impact on the value of the Fund.
A new or smaller fund is subject to the risk that its performance may not represent how the fund is expected to or may perform in the long term. In addition, new funds have limited operating histories for investors to evaluate and new and smaller funds may not attract sufficient assets to achieve investment and trading efficiencies.
Shares are bought and sold at market price (closing price) not net asset value (NAV) and are not individually redeemed from the Fund. Market price returns are based on the midpoint of the bid/ask spread at 4:00pm Eastern Time (when NAV is normally determined) and do not represent the return you would receive if you traded at other times. Brokerage commissions will reduce returns.
